Table of contents Introduction# This article covers best practices for optimizing workbook performance in Tableau Desktop. It provides practical guidance to identify and resolve performance issues, ensuring faster and more efficient visualizations.
General# As shown in the webinar video, this article is structured into four layers:
Presentation Analytics Data Platform Each section focuses on key aspects to help optimize your Tableau workbook’s performance.
Presentation# Sheet# Keep the sheet as simple as possible.Include only the data necessary for analysis.
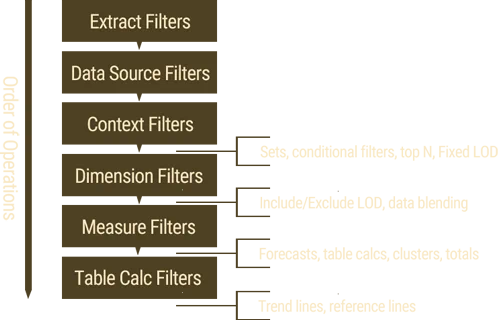
Remove unnecessary elements like parameters, sets, groups, calculated fields, and filters. Tableau is for data analysis, not just listing database contents. Use small cross tables for details, but large ones miss the tool’s purpose. Minimize the number of marks and avoid complex ones like polygons, donuts, and maps unless essential. Limit filters—favor filter actions and guided analysis. Dashboard# A dashboard consists of two types of zones:Data-driven: sheets, filters, parameters, page controls, legends. Non-data-driven: text, images, web content, blank spaces, layout containers. Minimize zones; each data-driven zone triggers a query (recommendation: under 10 zones). Interacting with dashboard elements (filters, parameters, actions) can trigger events and additional SQL queries.Global filters, filters applied across all sheets, and “Show Relevant Values” filters increase workload. A dashboard with 18 sheets could send 18+ queries—some cached, others not. Use input filters for long lists (e.g., customer names) instead of quick filters to reduce loaded values. Avoid large, high-resolution images. Improve cache efficiency by setting dashboards and stories to fixed size and using client-side rendering when possible. Workbook# Split large workbooks into separate files and use fewer sheets per dashboard. Remove unused sheets and hide those used only in the background. Analytics# Data Elements# Minimize data type conversions; perform them at the data source when possible.For example, if a date field is stored as a string, convert it at the source. Each conversion in Tableau triggers a query, increasing processing load. Filters# Avoid using “Only Relevant Values”; prefer “All Values in Hierarchy.” Use filters cautiously for small data sources. User filters and the ISMEMBEROF() function can impact cache sharing. Apply filters at the data source level. Limit the number of filters and use them efficiently. Avoid high-cardinality quick filters (multi-selection or dropdown lists).
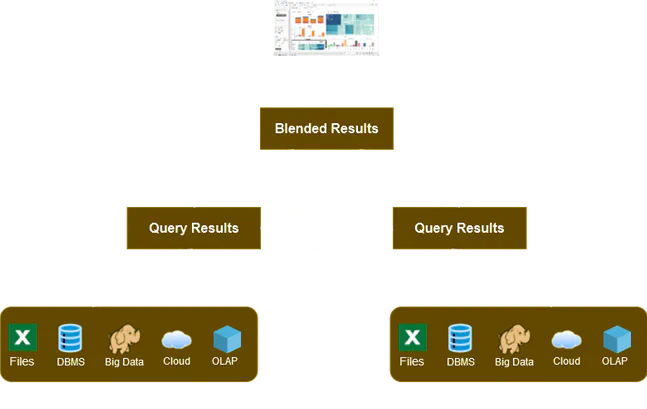
Calculations# External function calls (R, Python, MatLab ) can be slow. Integers are faster than dates , and booleans are faster than strings .Limit data blending ; it requires sequential queries across multiple sources.If possible, create a database view on the server instead. MIN and MAX perform better than AVG and ATTR .Use Tableau’s native features —groups, sets, bins, custom date fields, combined fields, and aliases—instead of calculations. Prefer optimized functions like CONTAINS(), DATEPARSE(), or MAKEDATE() for dates rather than complex calculated fields. Avoid COUNTD() when possible; it’s a slow function.Use CASE()groups instead of multiple IF statements. ELSEIFELSE IF.REGEXWorking across data sources#
Do not blend data on high cardinality dimensions. Data# Connection Type# A native connector is faster than an ODBC connection . An embedded data source can be faster than a published data source .However, prefer a published data source for reuse. On Tableau Cloud , prefer a direct connection over Tableau Bridge .Check with your security team. Data Connection# Centralize your data for faster access than extracting it from multiple sources.Connection Models# Limit custom SQL queries in live connections , as they may be inefficient.Instead, create a view in the database and connect Tableau to it. Avoid parameters in custom SQL. Tableau wraps them in a subquery, which many databases handle poorly. Look for unnecessary clauses like ORDER BY . Tableau will re-sort the data once loaded. Hide unused fields .Aggregate data.Filter data.Use materialized calculations . Monitor Tableau Server , for example with TabMon . Keep your database close to Tableau Server . Identify configuration, data, and workbook design issues.For example: a poorly designed workbook with high traffic can consume many server resources (CPU/Memory). Update Tableau Desktop and Server to improve performance and fix bugs.Upgrade hardware : RAM, CPU, disk (especially for extracts), and fast network.Separate VizQL Server nodes from Backgrounder nodes .For virtual machines :Virtualization incurs a performance overhead (10-20%) compared to physical infrastructure. Avoid shared virtual machines ! Resources#